

BIM+ speaks to Arup’s Andrew Duncan about how the Project Ove “Body Information Modelling” project set in train a series of initiatives to create a global BIM standard within the worldwide consultancy.
Two years ago, Arup launched Project Ove, a digital building model in the form of a 170m-tall human. The scheme was a vivid demonstration of what BIM could do with buildings, and what Arup could do with BIM, and in those respects the scheme was a success.
But another point to the exercise was to create techniques that could be used on real buildings – and to that end the project was an enlightening failure.
Andrew Duncan, a BIM manager specialising in M&E design, was one of the Arup engineers who came up with Project Ove. For him, the project revealed that the M&E techniques that mimicked the human tower’s circulatory and nervous systems required further development if they were to be used more widely.
He explains: “We found that the building blocks we needed weren’t in place. We didn’t have intelligent enough families or templates to facilitate the workflows we had demonstrated were possible.
"It wasn’t a problem with Revit. Revit is a blank canvas, and the quality of the picture that you’re going to paint is determined not just by your skill in using the tool, it’s the paints and paintbrushes that you use. Our problem was that we’d discovered ours weren’t good enough.”
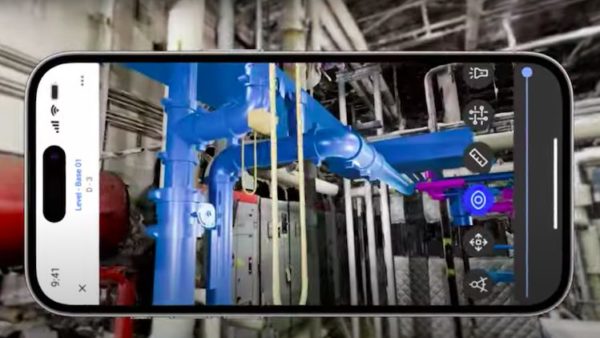
So, one outcome from the Project Ove at the firm has been the drive to create a bespoke object library that could be distributed through the UK, Middle East and Africa (UK-MEA) division of the company. This library will help to generate equipment datasheets and room datasheets directly from the BIM model, as well as automating COBie outputs.
What this amounts to, says Duncan, is the conceptualisation of Revit as a database that can articulate itself as a 3D model. “The data we have put into our families to produce equipment data sheets is the same data we need for the automated calculation processes used on Project Ove. We’re now working on the best way to make these processes available for use across the firm, which was our aim all along,” says Duncan.
Once this work is complete, in six to nine months, Arup will be in a position to think about ways to follow up on Project Ove, with an internal competition being one possibility.
But rolling out this version of BIM beyond the UK-MEA division has to deal with a problem that may sound trivial, but is surprisingly difficult to overcome: the lack of a common terminology for activities, even among countries sharing the same language.
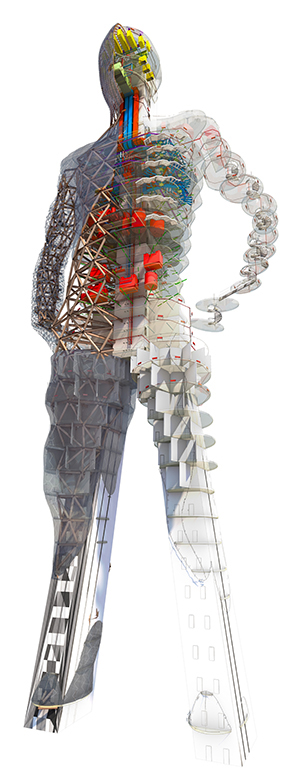
Project Ove was a digital building model in hte form of a 170m-tall human
“It’s never easy to recycle our investment across the rest of our business. One of the challenges we’ve had is that people call things by different names: in the UK we do M&E engineering, but in Australia it’s ‘hydraulic engineering’. Then there are the units. We work in litres per second for airflow and Americans work in cubic feet per minute. We want a consistent database for a third of Arup, and that would be a big achievement, but how do we translate that database for the rest of the business?”
Whereas the design industry has become increasingly globalised, the firms that construct its buildings have remained local, and speak their local dialects. So, even if Arup’s Australian arm were to adopt UK terminology, the local contractors wouldn’t understand what they were saying.
This is a serious issue for BIM, which can fulfil its potential only if it has datasets that can be passed around the world without the need for translation. “It sounds like a minor problem, but creating consistent data standards is an absolute nightmare,” says Duncan.
Arup is tackling this problem by working with buildingSMART, where it is the first engineering consultant to become a strategic advisory council member. The aim is to create a set of parameters for the data used within models: text labels for things like airflow and heating output that aren’t addressed in sufficient detail in the Industry Foundation Classes (IFC) dictionary.
“We’re looking to share our list of parameters with buildingSMART so we can recycle the investment we’ve made internally for the broader industry,” Duncan explains.
The problem with establishing a common understanding of BIM permeates construction, even within one country – or one company. Duncan gives the example of Level 2 BIM, the hook for the government’s BIM strategy. Challenge a company on its Level 2 “BIM-ness”, and it will respond that it is fully compliant. But, as Duncan says, there are no metrics to measure whether that is true or not – “and it doesn’t help that the definition is not finished and there’s been a lack of guidance about exactly what it means”.
Arup was sufficiently concerned about how it could measure its own BIM abilities to try to work out an objective way of doing so. But how was that to be done, given that knowledge of digital construction inevitably varied widely throughout the company, and assessing BIM’s productivity benefits for individual buildings was notoriously difficult?
The solution that Duncan came up with was to give a BIM “score” to all projects, and use them to determine the performance of an office, discipline, region, or the business as a whole.
“We don’t measure the building, rather we look at the processes that are being used to design it, based on the PAS 1192 system. So, a high score would be a project that has a BIM execution plan informed by the client’s information requirements, where BIM deliverables are addressed in contractual documents and the whole project team is signed up and working in a common data environment.
“Then we assess individual disciplines within the project, and this tells us which Arup disciplines are excelling and which are lagging. It also allows us to combine the data collected with other datasets within the business, such as financial performance, so we can look for correlations. We have a project under way to mine all the models that we are producing on our projects for metadata and we are combining that metadata with other metrics such as cost to shape our business practices.”
In the interests of raising the industry’s game, and establishing common practices, Arup has made the tool it uses, known as the Arup BIM Maturity Measure, freely available on its website, and the ICE and BIM4SMEs have since republished it.
The tool was originally called the “BIM dipstick”, but once again terminological issues intervened – as Duncan says, “one of our directors pointed out that ‘dipstick’ means something quite rude in another country”.
Arup is now working with buildingSMART to release an enhanced version, after a formal, and international, consultation process. “We’d like to see some significant stuff happen in the next six months,” Duncan says.
Achieving Level 2
As well the lack of a common vocabulary and a shared way of measuring how BIM-enabled a project is, the industry has failed to think through the meaning of “Level 2”, Duncan maintains.
“What we need to remember is that BIM Levels 1, 2 and 3 are effectively one client’s view of how we can use processes and technology to improve design, construction and operation. However, most of what is addressed is administrative: you need to collect COBie information at certain points in time, you have an execution plan that you map against the programme, and so on. What it doesn’t do is delve into the specifics of how that is achieved. I think everyone is so concentrated on achieving Level 2 they’re forgetting about how they produce data.”
Duncan gives as an example the use of spreadsheets to design a space according to desired performance criteria, such as the heating load per metre squared. “If we can pull that data into a Revit model we can combine that data with the squared area to give us the heating and cooling loads.”
This means that rather than doing calculations in Excel, which has no link with anything else, it could be done in Revit and used to automate the design. “Say you have four fan-coil units; what those units do in our intelligent database determines the water flow rate required to meet that heating load, which allows you automatically to size the pipes to provide that amount of water.
“Traditionally, we have a manual process of an engineer re-computing spreadsheets, printing a drawing and marking what’s changed and passing it to a software operator, we can amend the criteria and have the model highlight how that’s changed the loads required and allow an engineer to decide what to do. So, it’s an interlinked process of taking the data and reusing it. None of that is addressed in Level 2.”
So the BIM deliverables of Project Ove are visible to Arup – a common BIM language, a common BIM metric and a tighter focus on what the government’s definition of BIM leaves out. It’s still a work in progress, but it looks like Project Ove has been a success.

BIM Levels 1, 2 and 3 are effectively one client’s view of how we can use processes and technology to improve design, construction and operation. However, most of what is addressed is administrative. I think everyone is so concentrated on achieving Level 2 they’re forgetting about how they produce data.– Andrew Duncan, Arup