


A team at The Bartlett’s Centre for Advanced Spatial Analysis (CASA) will officially launch in September its pioneering drive to gather information on every building in London.
The project, named Colouring London, aims by 2021 to be the first port of call for open data on the characteristics of London’s buildings. As Londoners add their knowledge to the platform, the city’s buildings change colour to reflect the data.
Run by CASA, Colouring London has been developed in collaboration with Ordnance Survey, the Greater London Authority and Historic England. Its ambition is to lay the groundwork for similar resources that cities can use to shape sustainable development in a collaborative way, so it is inspired by open data crowdsourcing projects such as Wikipedia and OpenStreetMap, and by a growing number of “citizen science” initiatives, which involve non-specialist volunteers supporting scientists by adding data to online research platforms.
Researchers at CASA are looking for 12 types of information for every building in London: location, size and shape; type and age; who built it and how; how it is being used; whether it is protected; how sustainable it is; the greenery that surrounds it; the history of construction and demolition on its plot; and whether volunteers to the project like the building and feel that it contributes to the city.
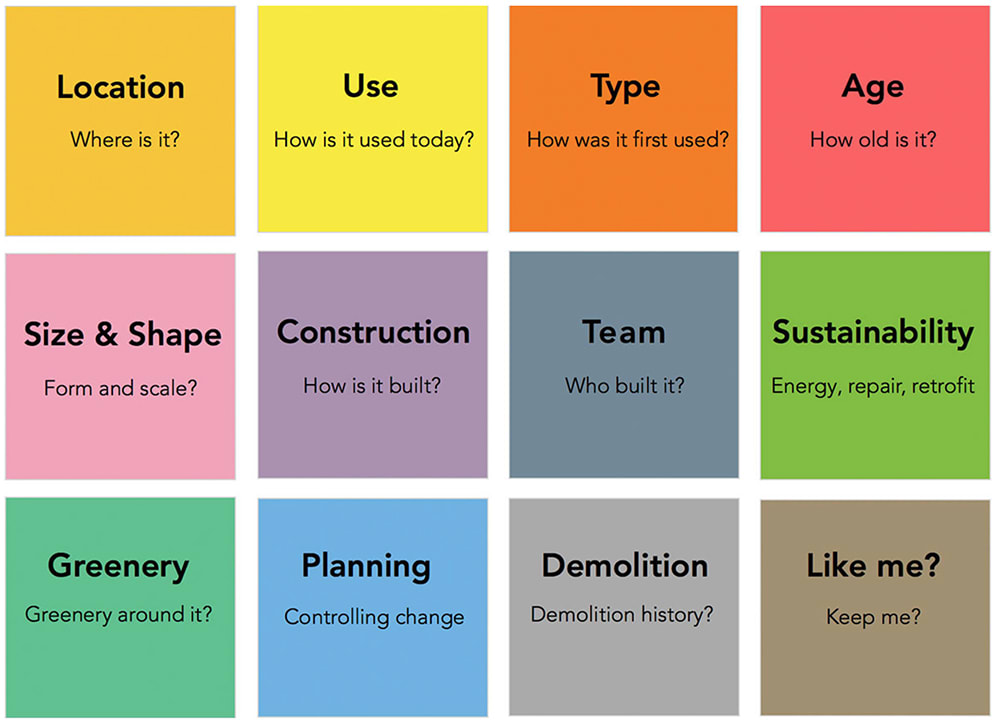
Colouring London is collecting 12 types of data on London’s buildings. Users on the platform can click on any box to find out more about each category. Credit: Colouring London
This will involve the collection of around 50 subcategories of data. Information can then be used by anyone wishing to download the data, to extract trends and statistics of relevance to many areas of research, from energy reduction and resource efficiency, to housing affordability and the development of economic vitality. Data will also be fed into predictive computational models being developed at CASA to test future scenarios for the city.
Polly Hudson, project director of Colouring London, says: “The free platform, which is currently in beta, is intended for use by everyone: the key role of colour visualisations and the simple interactive format are designed to make the process enjoyable and the results easy to interpret. Colouring London also revives, for the first time since the Second World War, a tradition of highly detailed, city-wide, colour-coded maps of London, of which Charles Booth’s 19th century depictions of poverty and the London County Council’s bomb damage maps, are the best-known examples.
“We’re very interested in working with diverse audiences – information on buildings is highly fragmented and this is about trying to address this problem, and at the same time help make sustainable development more of a collaborative process,” she adds.
A close up of Bloomsbury, London, taken from the Colouring London platform. The panel on the left-hand side allows users to add information about each of the buildings on the map. Credit: Colouring London