


Taylor Woodrow’s digital transformation strategy secured the infrastructure specialist a finalist slot in the Digital Contractor of the Year category at this year’s Digital Construction Awards. We talk to Millan Martin, the director behind the company’s digital approach.
BIMplus: Tell us about your role.
Millan Martin: I’m Taylor Woodrow’s director of engineering and digital, and head of Taylor Woodrow Engineering, a business unit within Taylor Woodrow. I’m the overall lead for engineering in the widest sense, but also for digital operations, digital engineering, design and information management and designers’ performance.
Our projects support the UK’s energy transition, deliver improvements to the highways network and enhance rail infrastructure. Current projects include EcoPark South, a flagship resource recovery facility for North London Waste Authority. This will have the capacity to manage 135,000 tonnes of recyclable material every year, and includes construction of a 190,000 cu m liquified natural gas (LNG) tank on the Isle of Grain for National Grid.
I joined the company seven years ago. Since 2019 my remit has included the creation of a benchmark digital transformation strategy, which we delivered in two years.

“Our objective was to digitise the way we work, rationalise reporting and establish a knowledge management system and a digital training framework.”
One of the actions of the strategy has resulted in setting up a ‘digital control centre’. This brings together all data from across the company’s operations into one central portal in a common format. This then allows us to import and analyse data between programmes to produce new performance information.
Can you explain the Taylor Woodrow digital strategy?
In 2019 I started a Masters in software engineering at Sheffield Hallam University and did a dissertation on digital transformation. On the back of this dissertation, I built the business case and undertook research about where we were as a company and as an industry. There were few, if any, examples of proper digital transformation.
The strategy set out a five-year vision to instil a collaborative culture based on the use of integrated data to improve value and efficiency across our core activities. Our objective was to digitise the way we work, rationalise reporting and establish a knowledge management system and a digital training framework. We launched the strategy in 2021 with a plan to implement the 23 actions by the end of 2023, which we have managed to achieve.
In the next two years we will concentrate on making sure our teams are using all the applications and systems we have set out and developed, as well as all the knowledge we gathered in the last three years. So we are going to intensify our training to everyone.
Can you give an example of the strategy’s impact on a project?
“The new workflow has eliminated the risk of inaccurate capture of data and reporting and slashed the time taken to collate, assess and report project progress.”
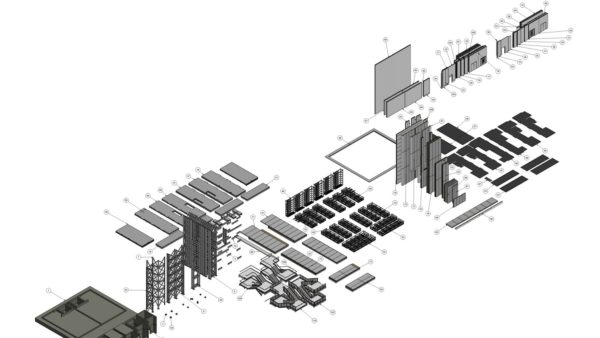
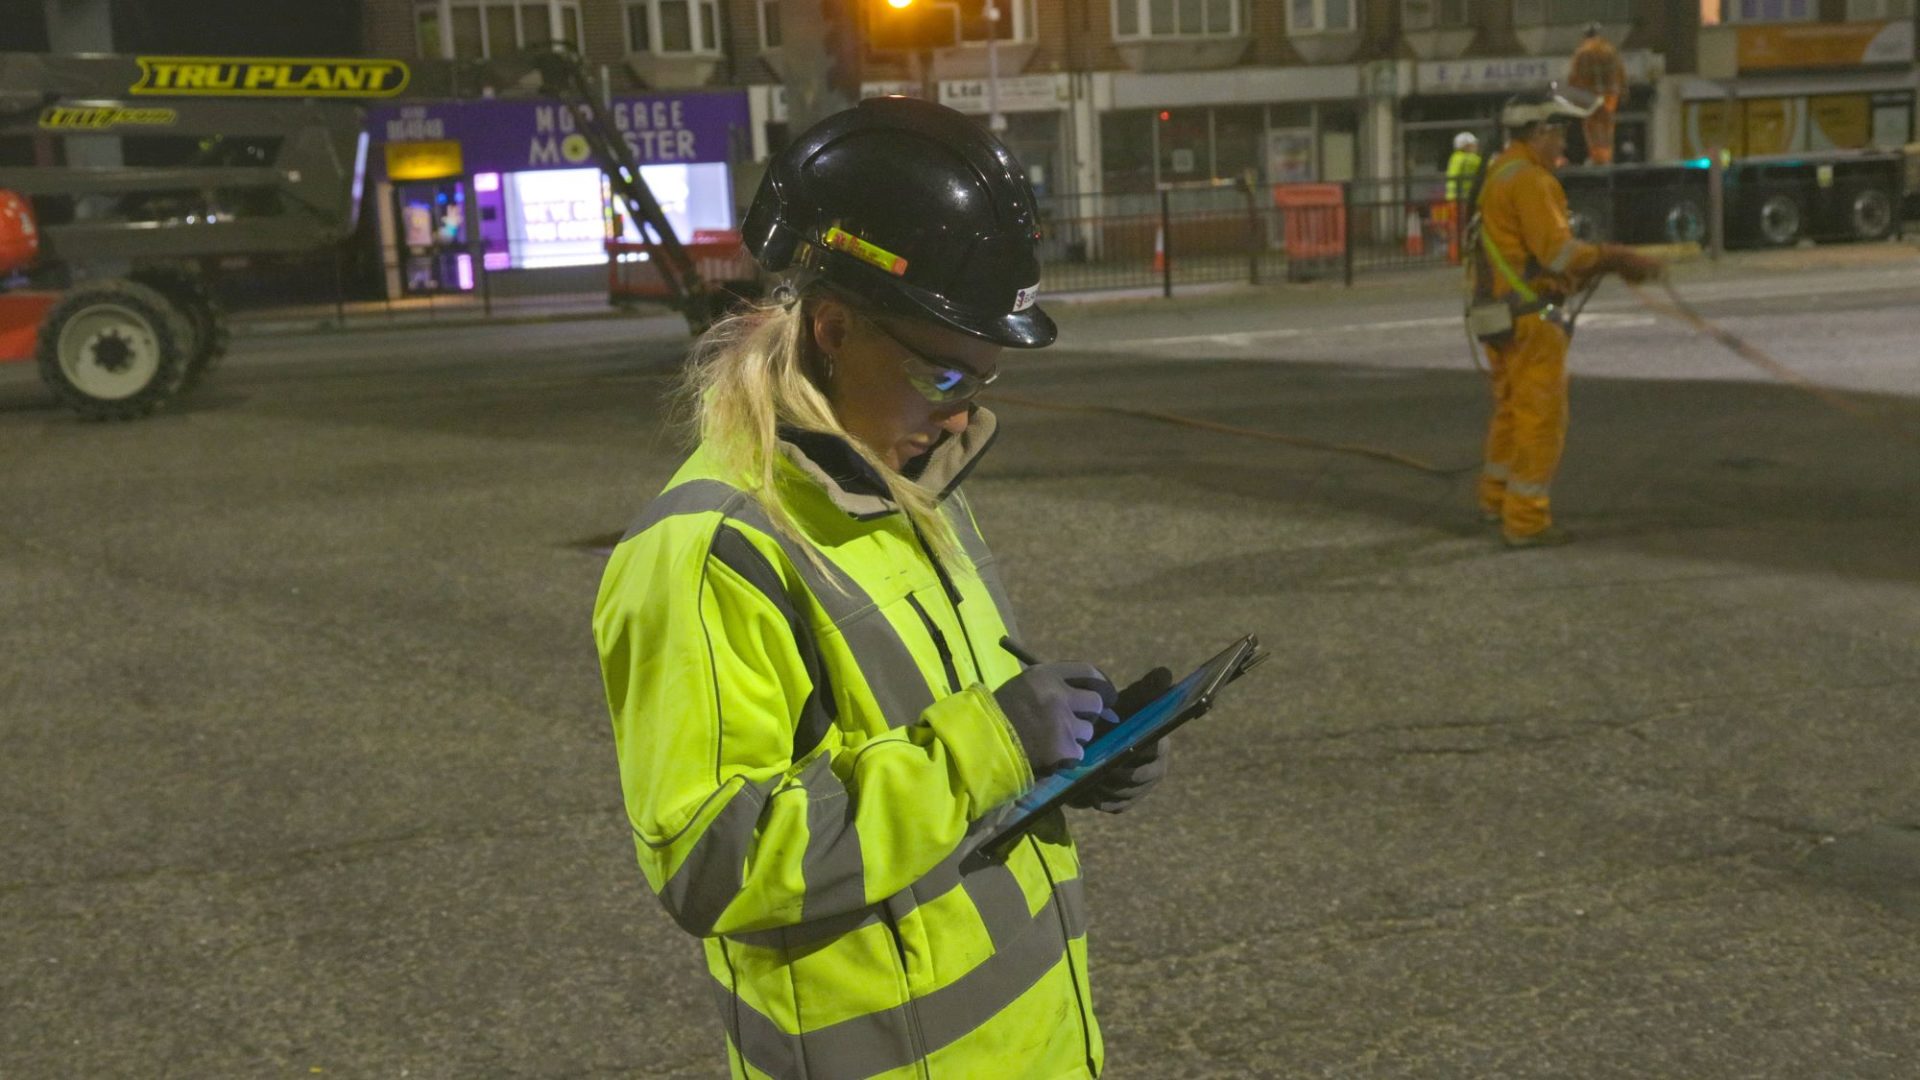
We have already changed the way we monitor progress on EcoPark South. The project team assigned tablets to site operatives so they could record the status of steel frame components from the digital model in relation to the construction progress. For example, ‘installed’, ‘tested’, or ‘awaiting inspection’. Each update automatically synced via the cloud and allowed project management to check the status via a Power BI dashboard. This process also updated the model, allowing other project stakeholders to view live progress in Synchro 4D Pro.
The new workflow has eliminated the risk of inaccurate capture of data and reporting and slashed the time taken to collate, assess and report project progress. We’re currently rolling it out across all of our projects.
What’s at the heart of the transformation?
I would say that we have pioneered the use of technology, like drone flights, and we do a lot of data engineering. But what we have embarked on is bringing data from all of our systems and software together in one reporting and control platform in standardised formats: our digital control centre.
We use apps like Viewpoint Field View, Altea and Aconex. But all of these tools produce siloed information, which cannot be linked or captured in a simple way. The beauty of what we’re doing is that we can extract data from the source and take this data to our cloud system. We are using different applications like Data Warehouse, Data Factory and API, which are part of the Microsoft Azure Cloud.
To take data from all the different pieces of software we use and to collect it in a way that allows us to compare two different sources, we put all the data in what we call a ‘data mart’, which is a database for particular types of information. We collate the data and we put in attributes that mean we can match one piece of information with the other.
That is easier said than done. We have had to create a single semantic system with data definitions. To enable us to do this work, we have established a data management team, with data engineers, software engineers, and AI. But we have worked with the whole company to understand how best to capture this information
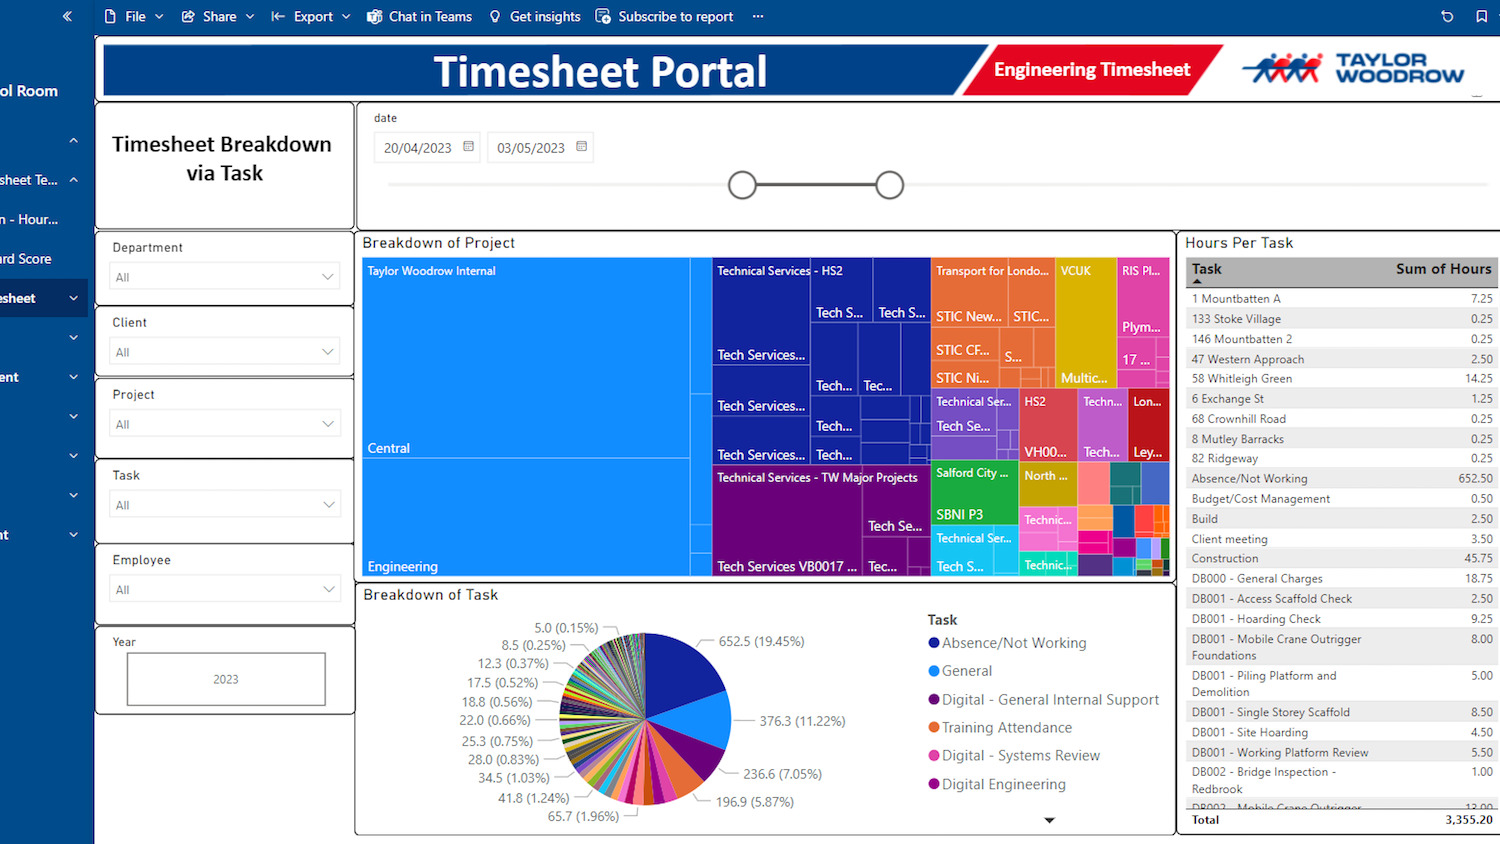
We then present the data in an easy-to-view way through Power BI.
How do you use this digital control centre?
We use it in all sorts of ways. For example, I can look at the productivity of different teams within the engineering business unit over the last month, and see which teams were the most productive.
We will use it to be more competitive in tenders, because we know the activities where we make money and where we lose money.
We can use it to control design on projects better because we can see what the root causes are for not meeting the programme, or the root causes for not meeting the budget.
And we will be able to use it to improve quality, because we can look at areas where we seem to be consistently having defects and put in place improvement plans for that.
Can you explain your knowledge management system?
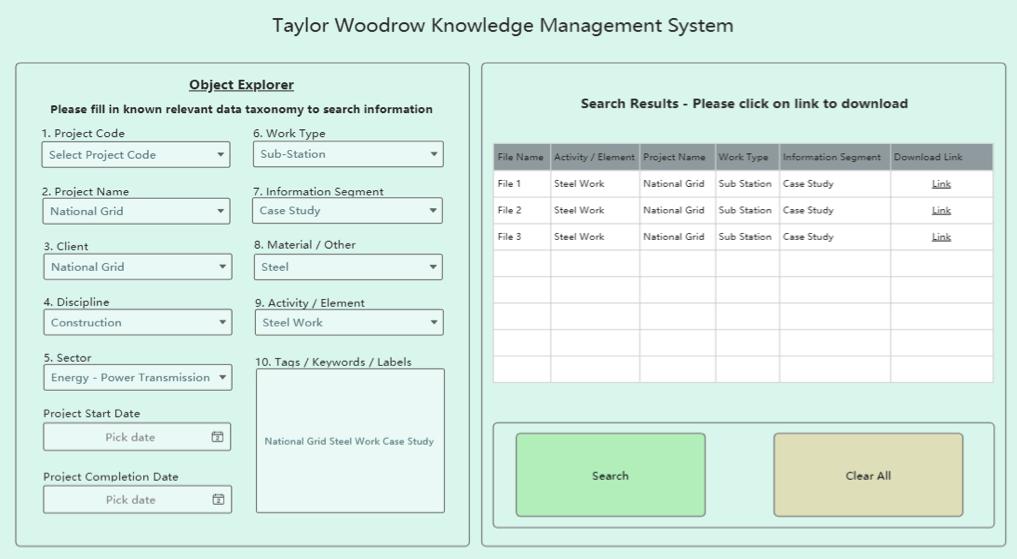
We are finalising the creation of a knowledge management system, whereby everyone will be able to log into a library of information that has been approved by subject matter experts in the company. It will capture learnings and best practice across everything that we do, ensuring that we use the knowledge gained from each project to continually improve. This system is related to the data control centre in that the classification of the elements and the data definition and data dictionary will be coherent for both systems.
Have you seen any cost savings to date?
The overarching target of our strategy has been to instigate a digital procedural mindset throughout core business procedures in compliance with ISO 19650.
We have seen a number of benefits. One is that resources are organised through a new workforce management system platform, which automatically tracks the location of Taylor Woodrow team members. This has saved at least four hours a month of administration time, giving a cost saving of £2,400 per project, per year.
Reporting across all disciplines, including commercial and productivity, using the Azure stack and Power platform, is reducing time spent on report production by 24 hours a month, compared with previous spreadsheet-based processes, plus eight hours for data capture per site. This has meant a saving of £134,000 across 32 projects.
The digitised quality assurance process we have introduced has provided reporting efficiencies totalling 2,200 hours.
Don’t miss out on BIM and digital construction news: sign up to receive the BIMplus newsletter.