


Housing providers have a wealth of data at their disposal to help improve their asset management, John Fisher of ARK Consultancy explains to Denise Chevin.
“If landlords can plan their investment better, they should be able to deliver housing solutions more efficiently and effectively, in a more consistent way.”
It was this philosophy that spurred John Fisher to develop a consultancy model that would help housing landlords improve asset management. Methodology that started out originally as an Excel spreadsheet has developed into a sophisticated software system that continues to evolve to meet modern-day challenges such as decarbonisation.
“Councils, arm’s length management organisations and housing associations own four million homes between them. Most of these organisations are already rich in data, because they hold a lot of information at property level, but it tends to be in different parts of an IT system in silos,” says Fisher, founder of ARK Consultancy.
“Information about customers, such as the age profile of the customer, or the length of tenancy, or receipt of benefits or occupancy levels, sits within housing management, which is people-based information, but it rarely gets looked at in comparison, for instance, to volume of repair requests, energy performance, void rates or the amount of investment needed in the property, or other data from outside the organisation like crime rates and levels of deprivation.

“There’s a demographic trend, but only by bringing a few different pieces of data together can we reveal that those trends exist.”
“We like data. We’ve looked at some cross-cutting data recently, and younger people asked for more repairs than, say, my generation, who tend to do that ourselves, whether you are a tenant or not. There’s a demographic trend, but only by bringing a few different pieces of data together can we reveal that those trends exist.”
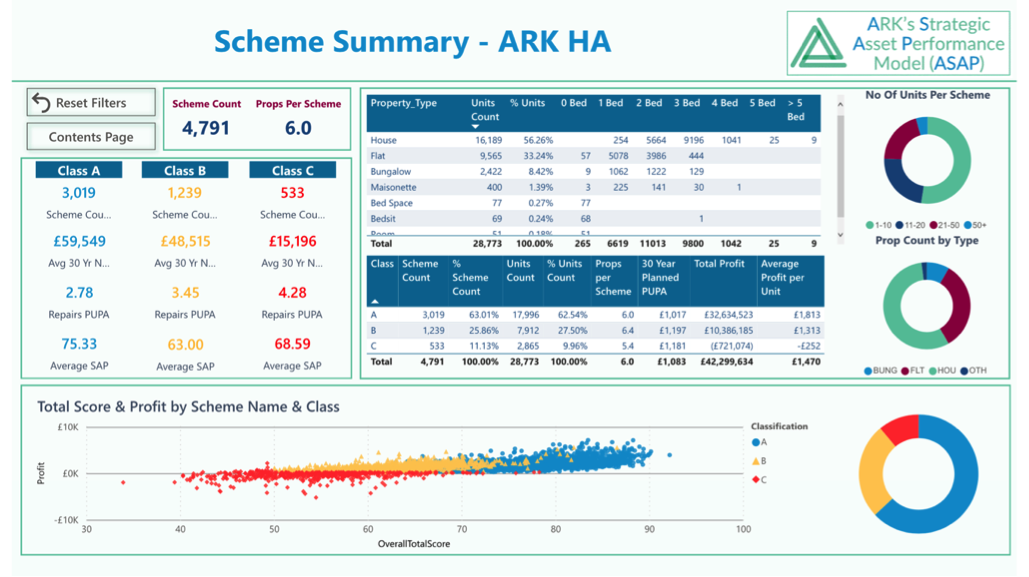
Fisher adds: “Our modeling does that at scale, and basically picks up data from across an organisation’s intelligence base at property level, and at scheme level. We also talk to the staff at the front end, ask them questions in a structured way and collect more data. We then bring in data from outside an organisation and model it in a sophisticated way. We call it the ARK ASAP Model (which stands for ARK’s Strategic Asset Performance model).”
Identifying underperforming assets
Fisher says that the modelling is translated into graphical terms: you can plot financial return on one axis, against an overall score on the other axis, which quickly shows underperforming assets. Overall score is made up of upwards of 60 weighted tests, while financial performance is made up of a profit/loss calculation.
“Housing which does not perform well because people don’t like it, receives lots of complaints, and tends to need more housing management input, so then it generally performs less well financially. It therefore needs more of a critical examination from an asset point of view than housing that people are basically happy with, and want to keep living in.
“If you monitor data, and you understand that relative performance, you have confidence in setting out a long-term asset management strategy.”
How is the system developing?
The next step is to integrate this data with thorough energy performance. “At the moment, we rely on Energy Performance Certificates, and SAP ratings, which are fairly basic,” Fisher says.
“The sector has universally made a commitment to decarbonisation, and investing in reducing the carbon impacts of the housing stock. But it doesn’t really know how to do it yet, at scale. I’m worried that because funding is available to help people improve the energy of their housing stock, we could waste money decarbonising housing that actually isn’t really fit for purpose.
“So we’re now looking at how we get thorough and accurate energy performance assessments, which is the first stage of understanding what needs to happen to a property, at an additional level of detail into the ASAP model.
“We also need some sort of accreditation that says ‘to be able to apply for funding or invest in the decarbonisation of a property, it’s got to be able to achieve so much improvement in terms of decarbonisation, but also, it must achieve a certain minimum score in terms of its overall performance’. If you put a rose on a dustbin, it’s still a dustbin!
“So, if you spend £20,000 improving the wall insulation and roof installation and windows and heating system in a property that people don’t really want to live in, because it has some other failing characteristics, it could be a waste of money.”
Is your software developed in-house?
“We have partnered with a software firm that not only manages the hosting for us, but also develops the database and the software that hones and crunches the data. And we have the capability to do the dashboard front end on Microsoft Power BI. We make the software bespoke to each customer. We put a team of housing asset experts to work with each client, to understand them, their assets and their data, and to develop their model.”
Has it ended up changing perceptions of what good asset management looks like?
“I think they use the word transformational in many cases. One example is at a housing association in the Welsh Valleys. Analysing the data on their properties, it became apparent that properties were performing badly in the most deprived area – where there was only one housing officer allocated per 400 properties, yet needed one per 200. Yet they were preforming better in and out of Cardiff and therefore only needed one housing officer per 800.
“Because we get involved with staff doing workshops and bringing the different parts of an organisation together, one of the biggest outcomes of our work is that it can change the culture of staff interactions. The staff behave and relate to each other differently. They now understand each other’s jobs and challenges and can have helpful conversations.
“But for plenty of organisations, the core outcome is that it then informs their asset management strategy. It means the board can be confident that they’re investing in the homes that they should be investing in.
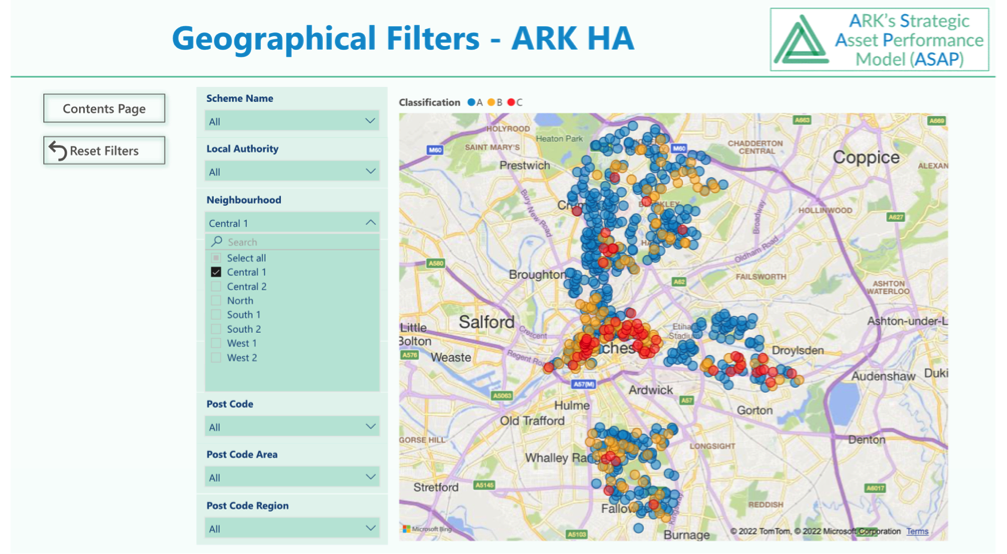
“Critically, when you get those little clusters of red dots on a map having plotting groups of underperforming and unpopular homes, you then start a process of investigation, and ask why is it like that? It gets them thinking about their operations differently.
“Typically, we’ll go back every year or two, and update an ASAP with the latest data. We’ve been doing that for one organisation for seven years. It’s informed their asset investment strategy. They decided they had an estate that was quite challenging, and that they’d do some targeted property sales with shared ownership.
“It is still affordable housing, but they started to change the overall tenure balance in what was a pretty mono-tenure estate. And they’ve been able to see the performance of the estate improve year to year, investing receipts in new rented homes elsewhere.”
Don’t miss out on BIM and digital construction news: sign up to receive the BIMplus newsletter.